
File:WorldWarII-GDP-Relations-Allies-Axis.png
Original file (640 × 630 pixels, file size: 20 KB, MIME type: image/png)
| This is a file from the Wikimedia Commons. Information from its description page there is shown below. Commons is a freely licensed media file repository. You can help. |
Summary
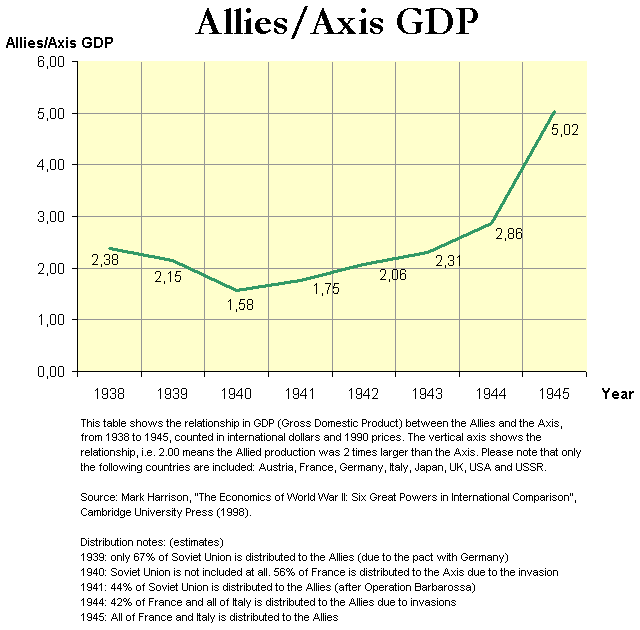
| Description | This table shows the relationship in GDP (Gross Domestic Product) between the Allies and the Axis, from 1938 to 1945, counted in international dollars and 1990 prices. The vertical axis shows the relationship, i.e. 2.00 means the Allied production was 2 times larger than the Axis. Please note that only the following countries are included: Austria, France, Germany, Italy, Japan, UK, USA and the Soviet Union. |
| Date | |
| Source | Mark Harrison, "The Economics of World War II", see more information below |
| Author | User:Dna-webmaster |
| Permission (Reusing this file) |
Public domain |
| Other versions |
 |
This table shows the relationship in GDP (Gross Domestic Product) between the Allies and the Axis, from 1938 to 1945, counted in international dollars and 1990 prices. The vertical axis shows the relationship, i.e. 2.00 means the Allied production was 2 times larger than the Axis. Please note that only the following countries are included: Austria, France, Germany, Italy, Japan, UK, USA and the Soviet Union.
Source: Mark Harrison, "The Economics of World War II: Six Great Powers in International Comparison", Cambridge University Press (1998).
Distribution notes: (estimates)
- 1939: only 67% of Soviet Union is distributed to the Allies (due to the pact with Germany)
- 1940: Soviet Union is not included at all. 56% of France is distributed to the Axis due to the invasion
- 1941: 44% of Soviet Union is distributed to the Allies (after Operation Barbarossa)
- 1944: 42% of France and all of Italy is distributed to the Allies due to invasions
- 1945: All of France and Italy is distributed to the Allies
Regards, Dennis Nilsson, Sweden.
If you wish to contact me, please leave a message on my talk page.
Licensing
| I, the copyright holder of this work, release this work into the public domain. This applies worldwide. In some countries this may not be legally possible; if so: I grant anyone the right to use this work for any purpose, without any conditions, unless such conditions are required by law. |
File history
Click on a date/time to view the file as it appeared at that time.
| Date/Time | Thumbnail | Dimensions | User | Comment | |
|---|---|---|---|---|---|
| current | 05:28, 21 December 2005 | | 640 × 630 (20 KB) | Dna-webmaster~commonswiki | This table shows the relationship in GDP (Gross Domestic Product) between the Allies and the Axis, from 1938 to 1945, counted in international dollars and 1990 prices. The vertical axis shows the relationship, i.e. 2.00 means the Allied production was 2 t |
File usage
Global file usage
The following other wikis use this file:
- Usage on be-tarask.wikipedia.org
- Usage on cs.wikipedia.org
- Usage on hy.wikipedia.org
- Usage on ja.wikipedia.org
- Usage on ru.wikipedia.org
- Usage on uk.wikipedia.org
- Usage on vi.wikipedia.org